The Science of Intranet Engagement
Curious to know more about the science behind the SMLWRLD Intranet Engagement Model? Here is a brief introduction to the model and how it works. For further information, please contact engagement@smallworlders.com.
SMLWRLD's Kevin Cody on the Science of Intranet Engagement
Defining Engagement
Before we can model the engagement of a site we first need to define it in a strict mathematical sense. So how do we do this?
To answer that question, consider a hypothetical fully engaged intranet. What would this look like? Here is our vision:
"100% of users visit the site once every day, view 10 pages every day, and perform each possible form of interaction once per visit."
This allows us to quantify engagement in terms of the total userbase and all possible forms of interaction.

Interest vs Activity
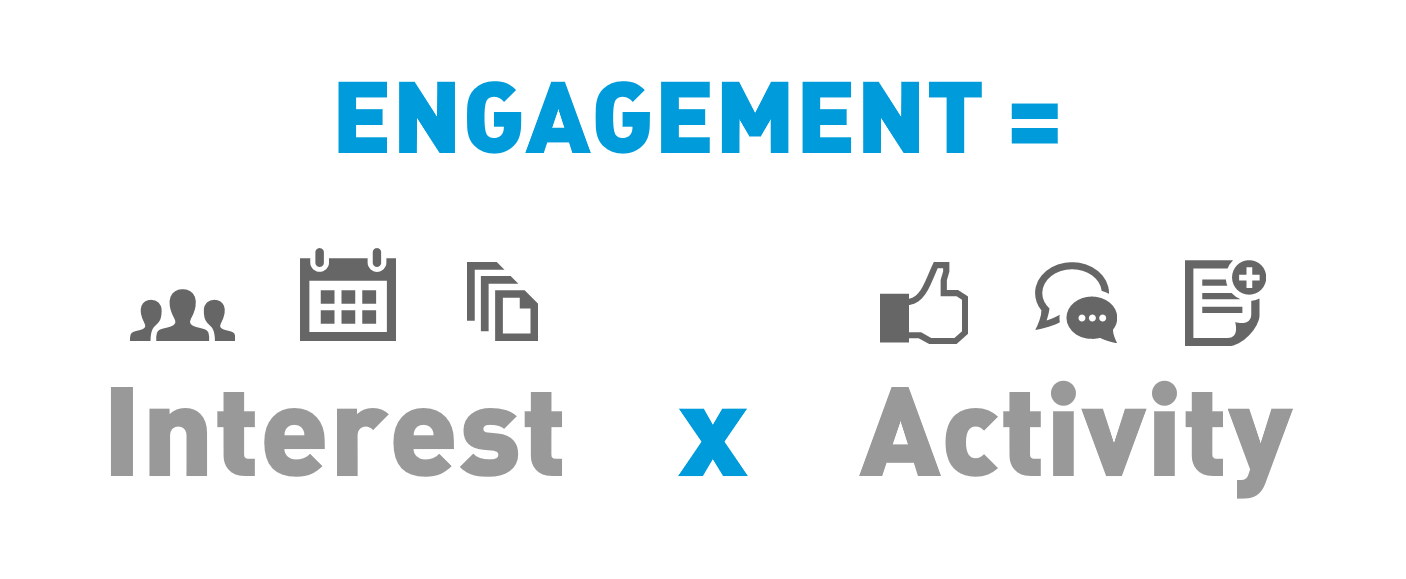
We can split our engagement definition into two entities: Interest and Activity.
The Interest concerns the visitors, how often they visit and how long they visit for.
The Activity concerns the interactions which the visitors are making with the site.

Engagement
The interest and the activity combine to form the Engagement, like this:
Visualising Engagement
Now that we have a precise definition of engagement, we can begin to think about it in a more precise way.
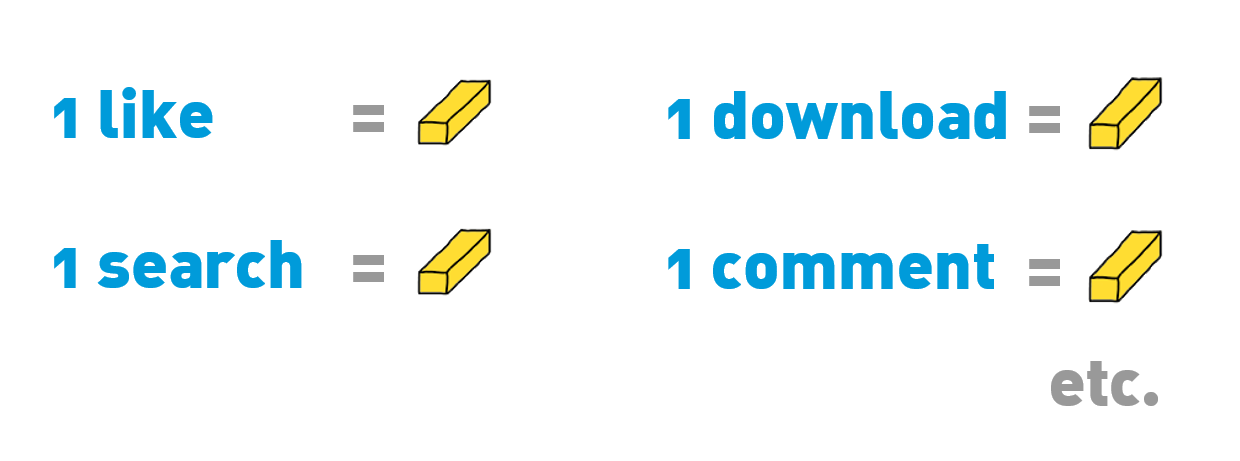
Imagine that every time a person interacts with the site, we receive a gold bar. So every time a user likes something, or every time a comment is left, we get 1 gold bar.
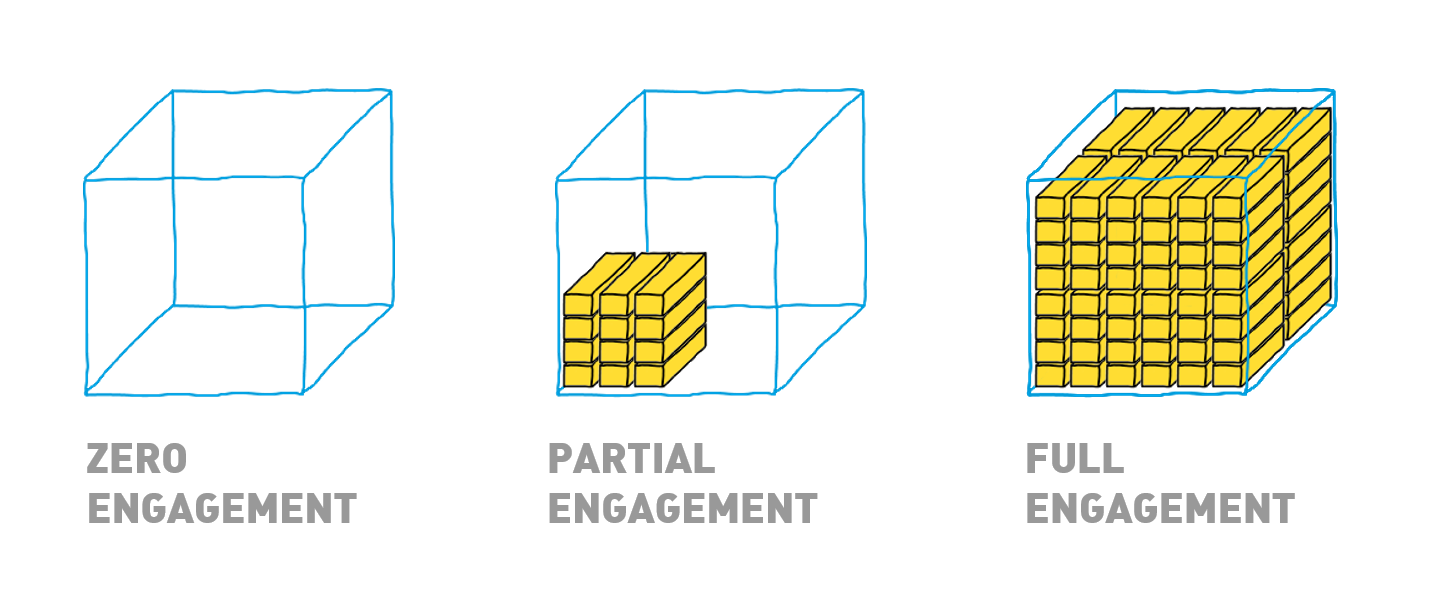
Now imagine we have a container for these gold bars. The size of the container is the same as the maximum number of gold bars that we could collect.
The container represents the 100% engagement mark, the site’s potential.

As you can see from the illustration:
- For a site with absolutely no interactions at all, the engagement will be zero.
- In a fully engaged site the container will be full to the brim of gold bars.
- In reality the container will be partially full of gold bars.
The engagement of the site is:
The measure of the volume of gold bars in the container, as a proportion of the total volume of the container.
Modelling Interest
So what about interest? How do we model this? As a reminder, the three interest criterea are:
- 100% of users (visitor volume)
- visit the site every day (visitor frequency)
- view 10 pages every day (visit depth)
These criteria can be applied to the container of gold bars to define the three dimensions of the box.

Full interest
A site with 100% interest will have each dimension at 100%.

Partial Interest
Now let’s imagine that half the userbase visited the site once every other day, and viewed 10 pages each visit. Each of the three dimensions will be half-filled.
Bear in mind the third criterion says that 10 pages should be viewed per day, so if 10 pages are viewed every other day then the third criterion will also be 50%.
You can see here that the interest is now less than 100%. In fact you can probably use common sense to see that the interest in this case would be 1/8th, or 12.5%

Interest
Mathematically multiplying the three dimensions together gives the same result.

Modelling Activity
The activity is a representation of all forms of interaction between users and the intranet. We categorise activity into three groups:
- Receptive interactions are interactions that involve a user consuming information from the intranet in some way. Examples of this are searches, downloads or video plays
- Active interactions involve the users contributing to the intranet in some way, for example a like, a comment or a post.
- Advocative interactions are those in which users spread the word about the intranet in some way, for example a share, or a twitter post.

100% Activity
let’s assume that every visitor performs every possible form of interaction once every visit. The activity would be 100%. Using our gold bars analogy with the 12.5% interest, the part of the container defined by the interest would be completely filled with gold bars.

50% Activity
Now let’s suppose each of the visitors performed half the number of possible forms of interaction on each visit.
Then only half the gold bars required to fill the interest would be there, and the activity would be 50%.

Compared to the total container, the gold bars represent the total engagement, which you can see is now 6.25%.

Engagement Score
To summarize:
The Activity is represented by the gold bars.
The Interest represents the upper limit of activity (i.e. 100% activity).
So to reach 100% engagement you must focus on both the interest and the activity.

Engagement Model
So here is the complete Engagement Model.
You take the raw data (the bottom row) and feed it into the model and out comes the engagement score.
As you can see there is much more to it than just a single engagement score.

Overview
The model has three key strengths. Firstly, each metric is meaningfully combined with the other metrics to build up a rich model of a site’s engagement. The model can be drilled into and explored, and it makes a powerful diagnostics tool.
Completeness
The second major strength is that all relevant aspects of a site’s activity are included, so you get a truly complete picture of your engagement.
Comparison
And finally, everything measured in terms of a site’s own potential. It does not rely on internal benchmarking or any subjective methods.
This means that sites can be meaningfully benchmarked against other sites.